
Z-score on a crypto pair is not what you think
The reason it fails on crypto pairs is everything around the math: drifting means, regime-shifting volatility, fake cointegration, missing costs and single-path backtests.
The z-score is correct math. It is just correct math applied to data that breaks the math’s assumptions.
When you compute a rolling z-score on the spread between two crypto perpetuals, you are doing the same arithmetic that has been in cointegration papers since 1987. The arithmetic is not wrong. What is wrong is that the inputs you are handing it do not satisfy the conditions it needs. The output has the right shape and the wrong meaning.
This is the most common reason traders bounce off pairs trading on crypto. The obvious version does not work. The idea can work. The implementation is the problem.
The mean drifts
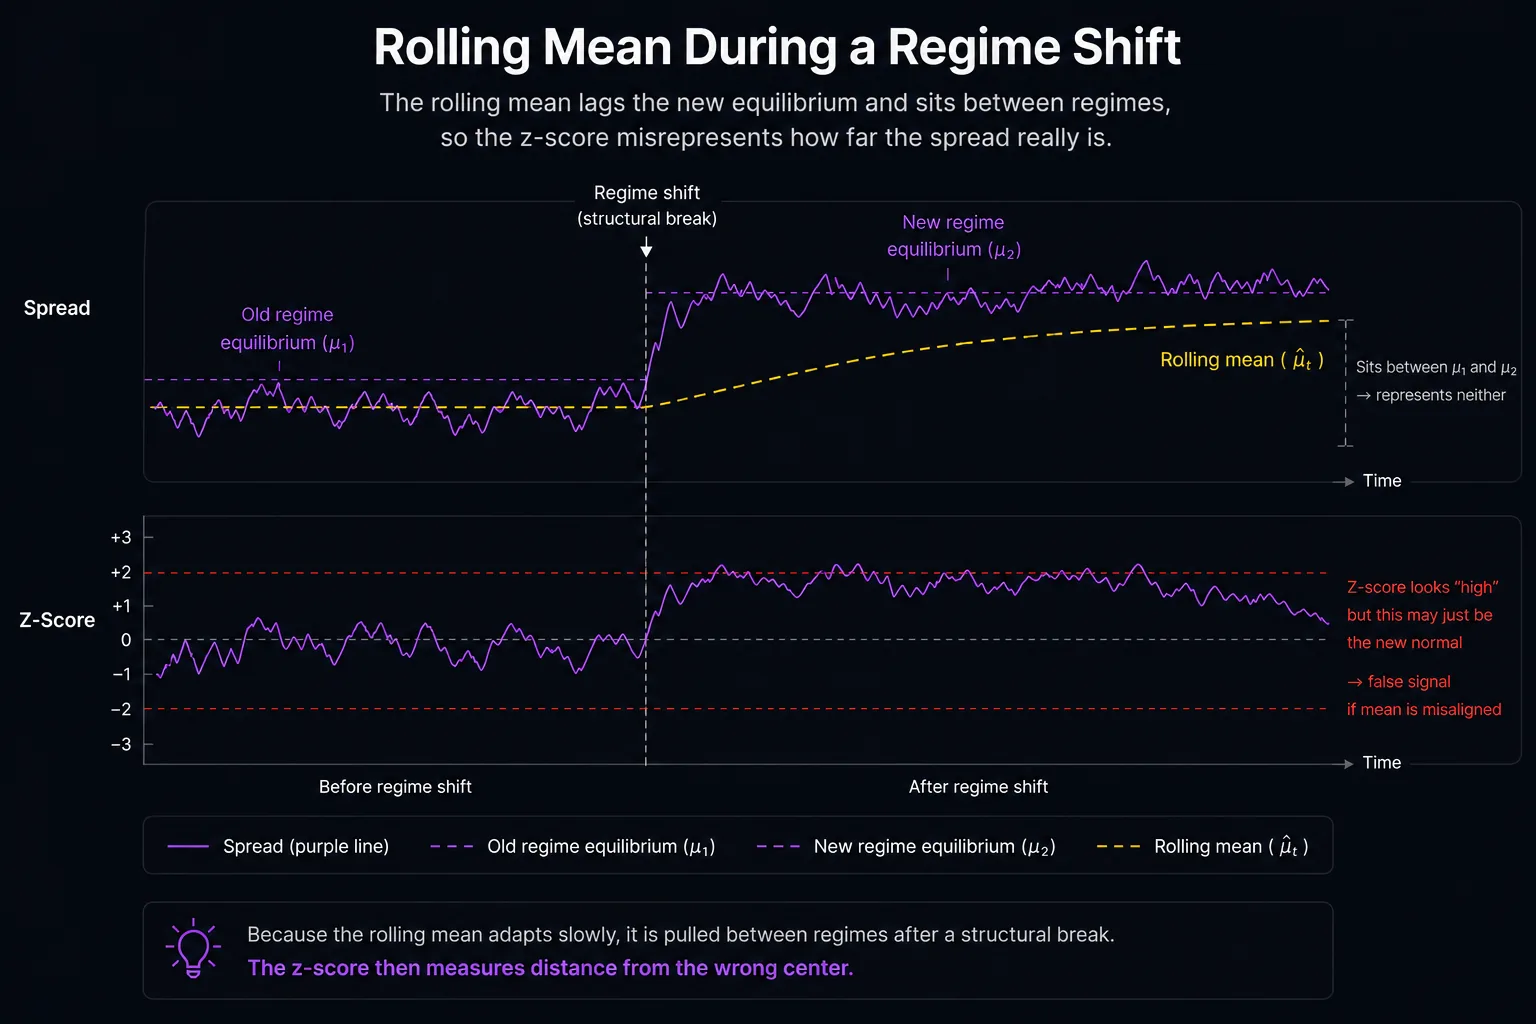
A z-score is (value − mean) / standard deviation. For the number to mean what the textbook says it means, the mean has to be the value the spread reverts to. On crypto pairs it usually is not.
Two perps that traded at a 1.0 ratio in March can sit at 0.85 in September because one leg grew faster, token economics changed or the relationship simply broke. A rolling mean across that change is averaging two different distributions. The z-score will tell you the spread is stretched when the reality is that the spread may have moved to a new equilibrium the window has not caught up to.
Engle and Granger pinned this down in 1987. A stationary spread requires the right hedge ratio for the current relationship. If the hedge ratio is stale, the spread is not stationary and everything downstream stops working.
The standard deviation drifts too
Same problem, denominator edition. The standard deviation in the z-score is supposed to represent normal volatility. If the spread’s volatility regime shifts, a fixed rolling window mixes two regimes into one number that fits neither.
Crypto volatility regimes do not move gradually. They can flip in a day. Entry signals computed against a stale denominator fire constantly during the turbulent period, then disappear only after the window finally catches up.
Krauss reviewed this problem in the literature. Regime-shift handling is one of the main sources of out-of-sample underperformance for naive z-score implementations.
The pair might not actually be cointegrated
The z-score on a spread only means something if the spread has a real equilibrium to revert to. If the two assets are not cointegrated, the spread is a random walk and the z-score is the z-score of a random walk. That is not a tradeable signal. It is a slow way to lose money.
Most visually correlated pairs are not cointegrated. Correlation captures common factors and common shocks. Cointegration captures a stable long-run equilibrium. Without a real qualifying test, the rest of the strategy is built on sand.
The backtest doesn't model the costs that matter
A backtest that says your z-score strategy was profitable but does not include funding and fees is reporting a fictional number. Perpetual futures pay funding at intervals each exchange sets per contract. Over a multi-day trade, funding can be one of the largest components of P&L.
Exchange fees are the next major piece. On a strategy working on tens of basis points of edge, the fee model is often the difference between profitable and not. Cost-aware backtesting is not optional.
A single backtest is one data point
If you ran the strategy on one historical window and it looked good, you have one data point. The historical path that happened is one draw from a distribution of paths that could have happened. Walk-forward partitioning, bootstrap and Monte Carlo are not sophistication. They are the minimum bar.
What a working implementation has to do
The problems above are not problems with the z-score itself. They are problems with what you feed into it. To make the math work on a crypto pair, the implementation has to do five things:
- Update the hedge ratio continuously so the mean is the right mean.
- Calibrate the normalisation scale to the current volatility regime.
- Filter pairs by structural compatibility before computing anything.
- Model funding and fees in the backtest.
- Resample the backtest so you have a distribution rather than a single point.
Hedgicore handles all five by building the spread differently in the first place. The full description is in the methodology paper. Read the methodology →
The point of this post is simply that the z-score is not broken. The standard way of using it on a crypto pair is.
References
- Engle, R.F. and Granger, C.W.J. (1987). Co-Integration and Error Correction. Representation, Estimation and Testing. Econometrica 55(2).
- Vidyamurthy, G. (2004). Pairs Trading. Quantitative Methods and Analysis. Wiley.
- Avellaneda, M. and Lee, J.H. (2010). Statistical Arbitrage in the U.S. Equities Market. Quantitative Finance 10(7).
- Krauss, C. (2017). Statistical Arbitrage Pairs Trading Strategies. Review and Outlook. Journal of Economic Surveys 31(2).
- Lopez de Prado, M. (2018). Advances in Financial Machine Learning. Wiley.
- Bonton AI, Hedgicore Research (2026). The Hedgicore Engine. A Methodology for Real-Time Statistical Arbitrage on Crypto Perpetuals. v2.0.
Hedgicore is a real-time pairs analytics platform powered by the Hedgicore Engine. Built by the team at Bonton AI.
Risk disclaimer: Hedgicore is an analytics platform. It does not execute trades or provide financial advice. All trading carries risk of loss.