
The hedge ratio is the whole game
A practical tour of six ways to estimate it and what choice signals about a stat-arb platform.
The single most important number in a pairs trade is the one most articles do not mention by name.
When you read about pairs trading online, you see a lot about z-score, entry and exit thresholds and which pairs to pick. You rarely see anyone walk through the actual ratio between the two legs of the trade. That ratio is called the hedge ratio, usually written β, and getting it right is the entire technical problem. Everything else is decoration.
Get the hedge ratio wrong and your spread is not actually mean-reverting. The math behind every entry rule depends on the spread having a stable equilibrium to revert to. The hedge ratio is what makes that equilibrium exist. Get it wrong, the rest of the strategy is computing the z-score of a random walk and handing you noise.
What β actually is
Two assets, BTC perp and ETH perp, trade at different price levels. Their prices move together but not one-for-one. If BTC goes up 1%, ETH might go up 1.4% on average. To trade the relationship, you build a spread that combines them in the right proportion:
spread = ETH − β × BTC
The β is how much BTC you have to short for every unit of ETH you go long (or vice versa). When β is right, the spread is a stable mean-reverting number. When β is wrong, the spread drifts with one of the legs and you stop trading the relationship; you start trading direction.
The right β changes over time. The relationship between BTC and ETH in March is not the relationship in September. Token economics shift, dominance flows in and out, the funding regime changes. A hedge ratio fitted once and held forever stops being correct surprisingly fast on crypto perps.
Six ways to estimate it
The academic and practitioner literature offers six common estimators. Each one optimises for something different. None of them is the right answer for every case. Knowing which estimator a platform uses tells you what the platform is optimising for, and where it is likely to fail.
OLS
Optimises for. Squared Y-residuals.
Symmetric? No. Online? Approx..
Use when. Quick first estimate, when Y is plausibly the noisier leg.
What it costs you. Asymmetric. Swapping which variable goes on the left-hand side changes the answer.
TLS
Optimises for. Perpendicular residuals.
Symmetric? Yes. Online? Approx..
Use when. Symmetric pairs where both legs are noisy in comparable amounts.
What it costs you. Slower than OLS, sensitive to noise-variance ratio between the two series.
Johansen
Optimises for. Cointegration likelihood.
Symmetric? Yes. Online? No (batch).
Use when. When you need more than two legs or want a formal rank test.
What it costs you. Sensitive to lag-length and deterministic-term choices.
Box-Tiao
Optimises for. Predictability of the combination.
Symmetric? No. Online? No (batch).
Use when. When mean-reversion speed is what you actually care about.
What it costs you. Asymmetric. Picks the direction that is most predictable, not most fitted.
Kalman filter
Optimises for. Posterior under a state-space model.
Symmetric? Yes. Online? Yes.
Use when. Continuous online estimation as the hedge ratio drifts.
What it costs you. Hyperparameter tuning (Q, R) matters. Latent-state output is harder to interpret.
Half-life or ADF optimisation
Optimises for. Direct trading-relevant property.
Symmetric? No. Online? No (batch).
Use when. When you can validate the choice on out-of-sample data.
What it costs you. Introduces selection bias. Sampling distribution is non-standard.
The continuity problem nobody warns you about
Every estimator on the list except Kalman is a batch fit. You run it on a window, you get a β, you use that β until you re-estimate. Then you re-estimate, and β changes.
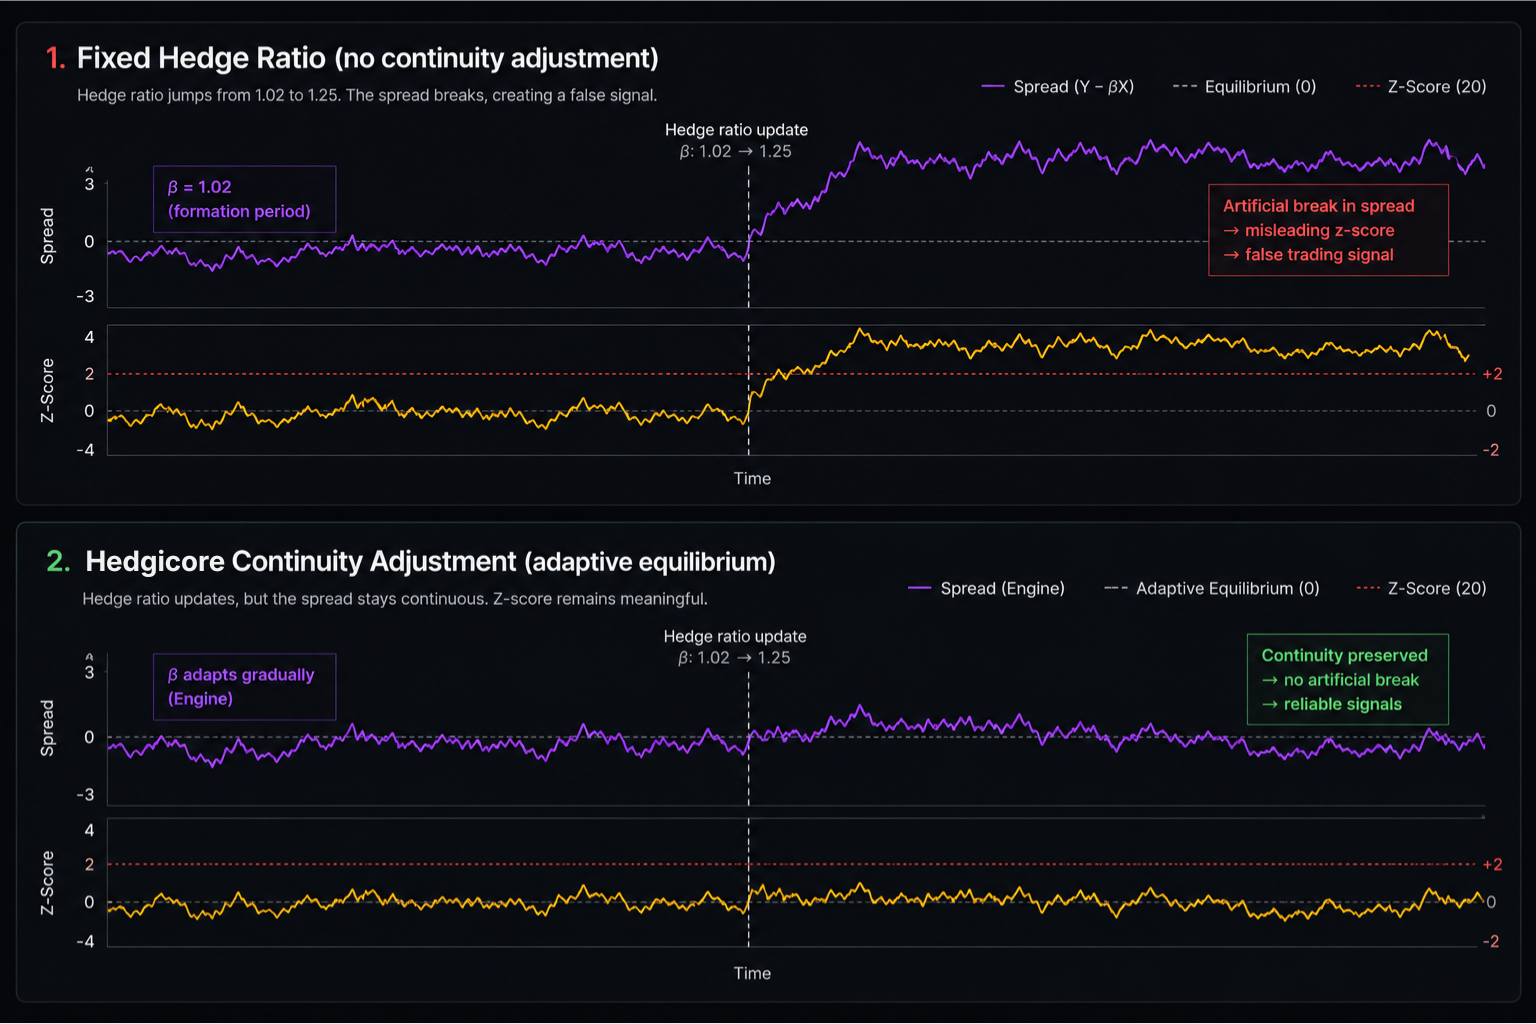
The moment β changes, the spread jumps. The new β applied to today s prices produces a different spread value than the old β did yesterday. If you compute a rolling z-score on the spread across the jump, the window straddles two different distributions and produces spurious entry signals for the duration of the rolling window.
There are four conventional responses to this problem. Continuous online re-estimation eliminates the jumps but introduces continuous estimator jitter. Static estimation eliminates the jumps and goes stale. Periodic re-estimation with no adjustment accepts the jumps as a known contamination zone. Periodic re-estimation with spread adjustment offsets the displayed and statistically-evaluated spread so it stays continuous across updates. Each of these has real tradeoffs. None of them is invisible.
How a platform handles this is one of the highest-information questions you can ask. The implementation paper covers all four responses in detail: Pairs Trading Implementation §3.5.
What this means for evaluating a stat-arb platform
Read the platform s documentation. Ask three questions.
1. Which estimator? If the platform does not say, it is hiding the answer or has not made the choice deliberately. Either is a red flag.
2. Static, periodic or continuous? If the platform re-estimates periodically, how often? If it is continuous, what hyperparameters control the responsiveness?
3. How is the continuity problem handled? If the platform updates β periodically and the spread jumps, the displayed indicators on the jump bar are misleading. A platform that has thought about this will say so.
Hedgicore handles all three of these questions in the methodology paper. The Engine s hedge ratio is adaptive, the update mechanics keep the displayed spread continuous across changes and the indicators built on top (Stretch, Flow, Envelope, Pulse, Glide) are calibrated against the adaptive equilibrium rather than against a fixed window. The specific estimator and update cadence are not disclosed publicly. The design principles are.
The takeaway
β is not a hyperparameter to tune. β is the parameter the entire strategy is built on top of. A pairs-trading workflow that treats the hedge ratio as an afterthought is a workflow that has not understood what it is doing.
If you read one academic reference on this, read Vidyamurthy (2004). If you read two, add Engle and Granger (1987). If you want the full technical treatment with all six estimators and the comparative table, the Hedgicore implementation paper has it.
References
- Engle, R.F. and Granger, C.W.J. (1987). Co-Integration and Error Correction. Representation, Estimation and Testing. Econometrica 55(2).
- Johansen, S. (1988). Statistical analysis of cointegration vectors. Journal of Economic Dynamics and Control 12(2-3).
- Box, G.E.P. and Tiao, G.C. (1977). A canonical analysis of multiple time series. Biometrika 64(2).
- Kalman, R.E. (1960). A new approach to linear filtering and prediction problems. Journal of Basic Engineering 82(1).
- Elliott, R.J., van der Hoek, J. and Malcolm, W.P. (2005). Pairs trading. Quantitative Finance 5(3).
- Vidyamurthy, G. (2004). Pairs Trading. Quantitative Methods and Analysis. Wiley.
- Bonton AI, Hedgicore Research (2026). Pairs Trading Implementation. Hedge Ratio Estimation, Trading Rules and Backtesting. v1.0.
Hedgicore is a real-time pairs analytics platform powered by the Hedgicore Engine. Built by the team at Bonton AI.
Risk disclaimer: Hedgicore is an analytics platform. It does not execute trades or provide financial advice. All trading carries risk of loss.