
3.1
Adaptive to regime, not frozen in formation.
The Engine maintains a hedge relationship that updates as new market data arrives. Not estimated once and frozen, not left in constant jitter.
METHODOLOGY PAPER · V2.0 · MAY 2026
A methodology for real-time statistical arbitrage on crypto perpetuals.
Bonton AI, Hedgicore Research. v2.0. May 2026.
Paper available after launch. Waitlist members get the PDF first.
Statistical arbitrage on cryptocurrency perpetual futures is a different problem from the same strategy on equities. Markets are open continuously, the data generating process is non-stationary on shorter time scales than equity markets, transaction costs and funding payments are first-order considerations and the tradeable universe has been reshaped multiple times in the last five years by exchange listings, delistings and structural shifts in liquidity.
The Hedgicore Engine is the modelling layer of the Hedgicore platform. It is built around the observation that the textbook pairs-trading recipe (cointegration test, fixed hedge ratio, static z-score thresholds) fails on crypto perpetuals in predictable, characterisable ways. This paper explains the Engine's design principles and validation scope, plus the five branded indicators it exposes and what the backtest does and does not model. It does not unpack the private estimator logic. That is the part of the platform that does not exist elsewhere, and it stays under the hood.
§1
Pairs trading was developed on US equities in the late 1980s and refined for the next three decades on the same substrate. Most of the canonical literature (Gatev, Goetzmann and Rouwenhorst 2006; Vidyamurthy 2004; Engle and Granger 1987; Pole 2007) assumes the substrate looks like equities. Crypto perpetuals do not.
Crypto perpetuals trade 24/7/365. There is no closing auction, no opening rotation, no overnight gap to absorb information. Models calibrated against daily-bar US equity data systematically over-fit the structure of a market that opens and closes. On crypto they leak into the intraday noise that an equity market would have moved through during its session.
Equity pair relationships are reshaped on the order of quarters: corporate actions, earnings surprises, sector rotations. Crypto pair relationships drift on the order of weeks. A hedge ratio that was correct in March is rarely correct in June. Any model that assumes a stable relationship over the full backtest horizon is reporting an artifact, not a strategy.
Perpetuals fund every eight hours. The funding mechanism injects a structural cash flow into every position that has no analog in spot equities. Strategies that ignore funding will report inflated returns on the short-funding side and absorb invisible drag on the long side. Funding is not noise. It is a first-class input to the model.
A pair like BTC/ETH has institutional-scale depth on both legs. A pair like ARB/MATIC has retail-scale depth on at least one leg and suffers a different set of microstructure pathologies. A model that treats the two pairs identically will misprice the second.
A pair traded on Binance and the same pair traded on Bybit are not the same instrument. They have different fee tiers, different funding cadences, different liquidation engines, different order book structures and different maker rebates. Naive cross-venue cointegration ignores all of this.
The cumulative effect: every assumption that the textbook pairs-trading literature makes about its substrate is either invalidated or strained on crypto perpetuals. The methods still work. But they need to be rebuilt for the substrate, not ported.
§2
The Hedgicore Engine is an architectural response to specific, public failure modes of off-the-shelf implementations. Each of these is publicly known; none of this is a Hedgicore disclosure. We name the failure modes so that readers can recognise them in their own backtests and on other platforms.
The canonical signal in pairs trading is a z-score on the spread, computed against its mean and standard deviation over a rolling lookback window (Engle and Granger 1987). On a stationary spread, this works as designed. On a spread whose generating process shifts mid-window, the mean and standard deviation are estimates of an artifact: a distribution that no longer exists. Entry signals fire because the spread is unusual against a window that has half pre-regime-change data and half post-regime-change data, neither of which is representative of the present.
The Gatev et al. (2006) formulation freezes the hedge ratio at the end of the formation window and trades it for the next six months. This was defensible on US equities in 1962 to 2002. On crypto perpetuals, the hedge ratio drifts on a timescale substantially shorter than any reasonable trading window. A frozen β backtest over six months is computing the equity curve of a pair that no longer exists by month two.
The Engle-Granger and Johansen tests answer the question "is the residual stationary in this sample?" They do not answer "will it remain stationary out of sample?", which is the question a trader actually has. Treating the test as a one-time gate selects pairs that were cointegrated during the formation window and may or may not be cointegrated during the trade. Krauss (2017) is explicit about this caveat. Production systems routinely ignore it.
A pairs-trading backtest that does not explicitly model perpetual funding payments will over- or under-report PnL by a meaningful margin depending on which side carried the funding. A backtest that fills every order at the mid-price will report PnL that no live system can reproduce. These are not subtle effects. They are first-order. We have seen platforms ship backtests with neither.
Lopez de Prado (2018) is unsparing on this: a single historical path is one draw from an unknown distribution. The fact that a strategy worked on the one path that actually happened is weak evidence that it will work on the path that will. Robust validation requires resampling, walk-forward partitioning and ideally Monte Carlo simulation under economically motivated processes. A backtest that shows you one equity curve and no resampled distribution is showing you noise.
§3
The server-side modelling layer behind the premium tier. Computes the adaptive equilibrium per pair, the regime classification and the pair-qualification filter. The free-tier indicators run in your browser against raw spread inputs. The Engine tier runs the same statistics against inputs the Engine prepared. It is governed by five design principles. Implementations may evolve; the principles do not.
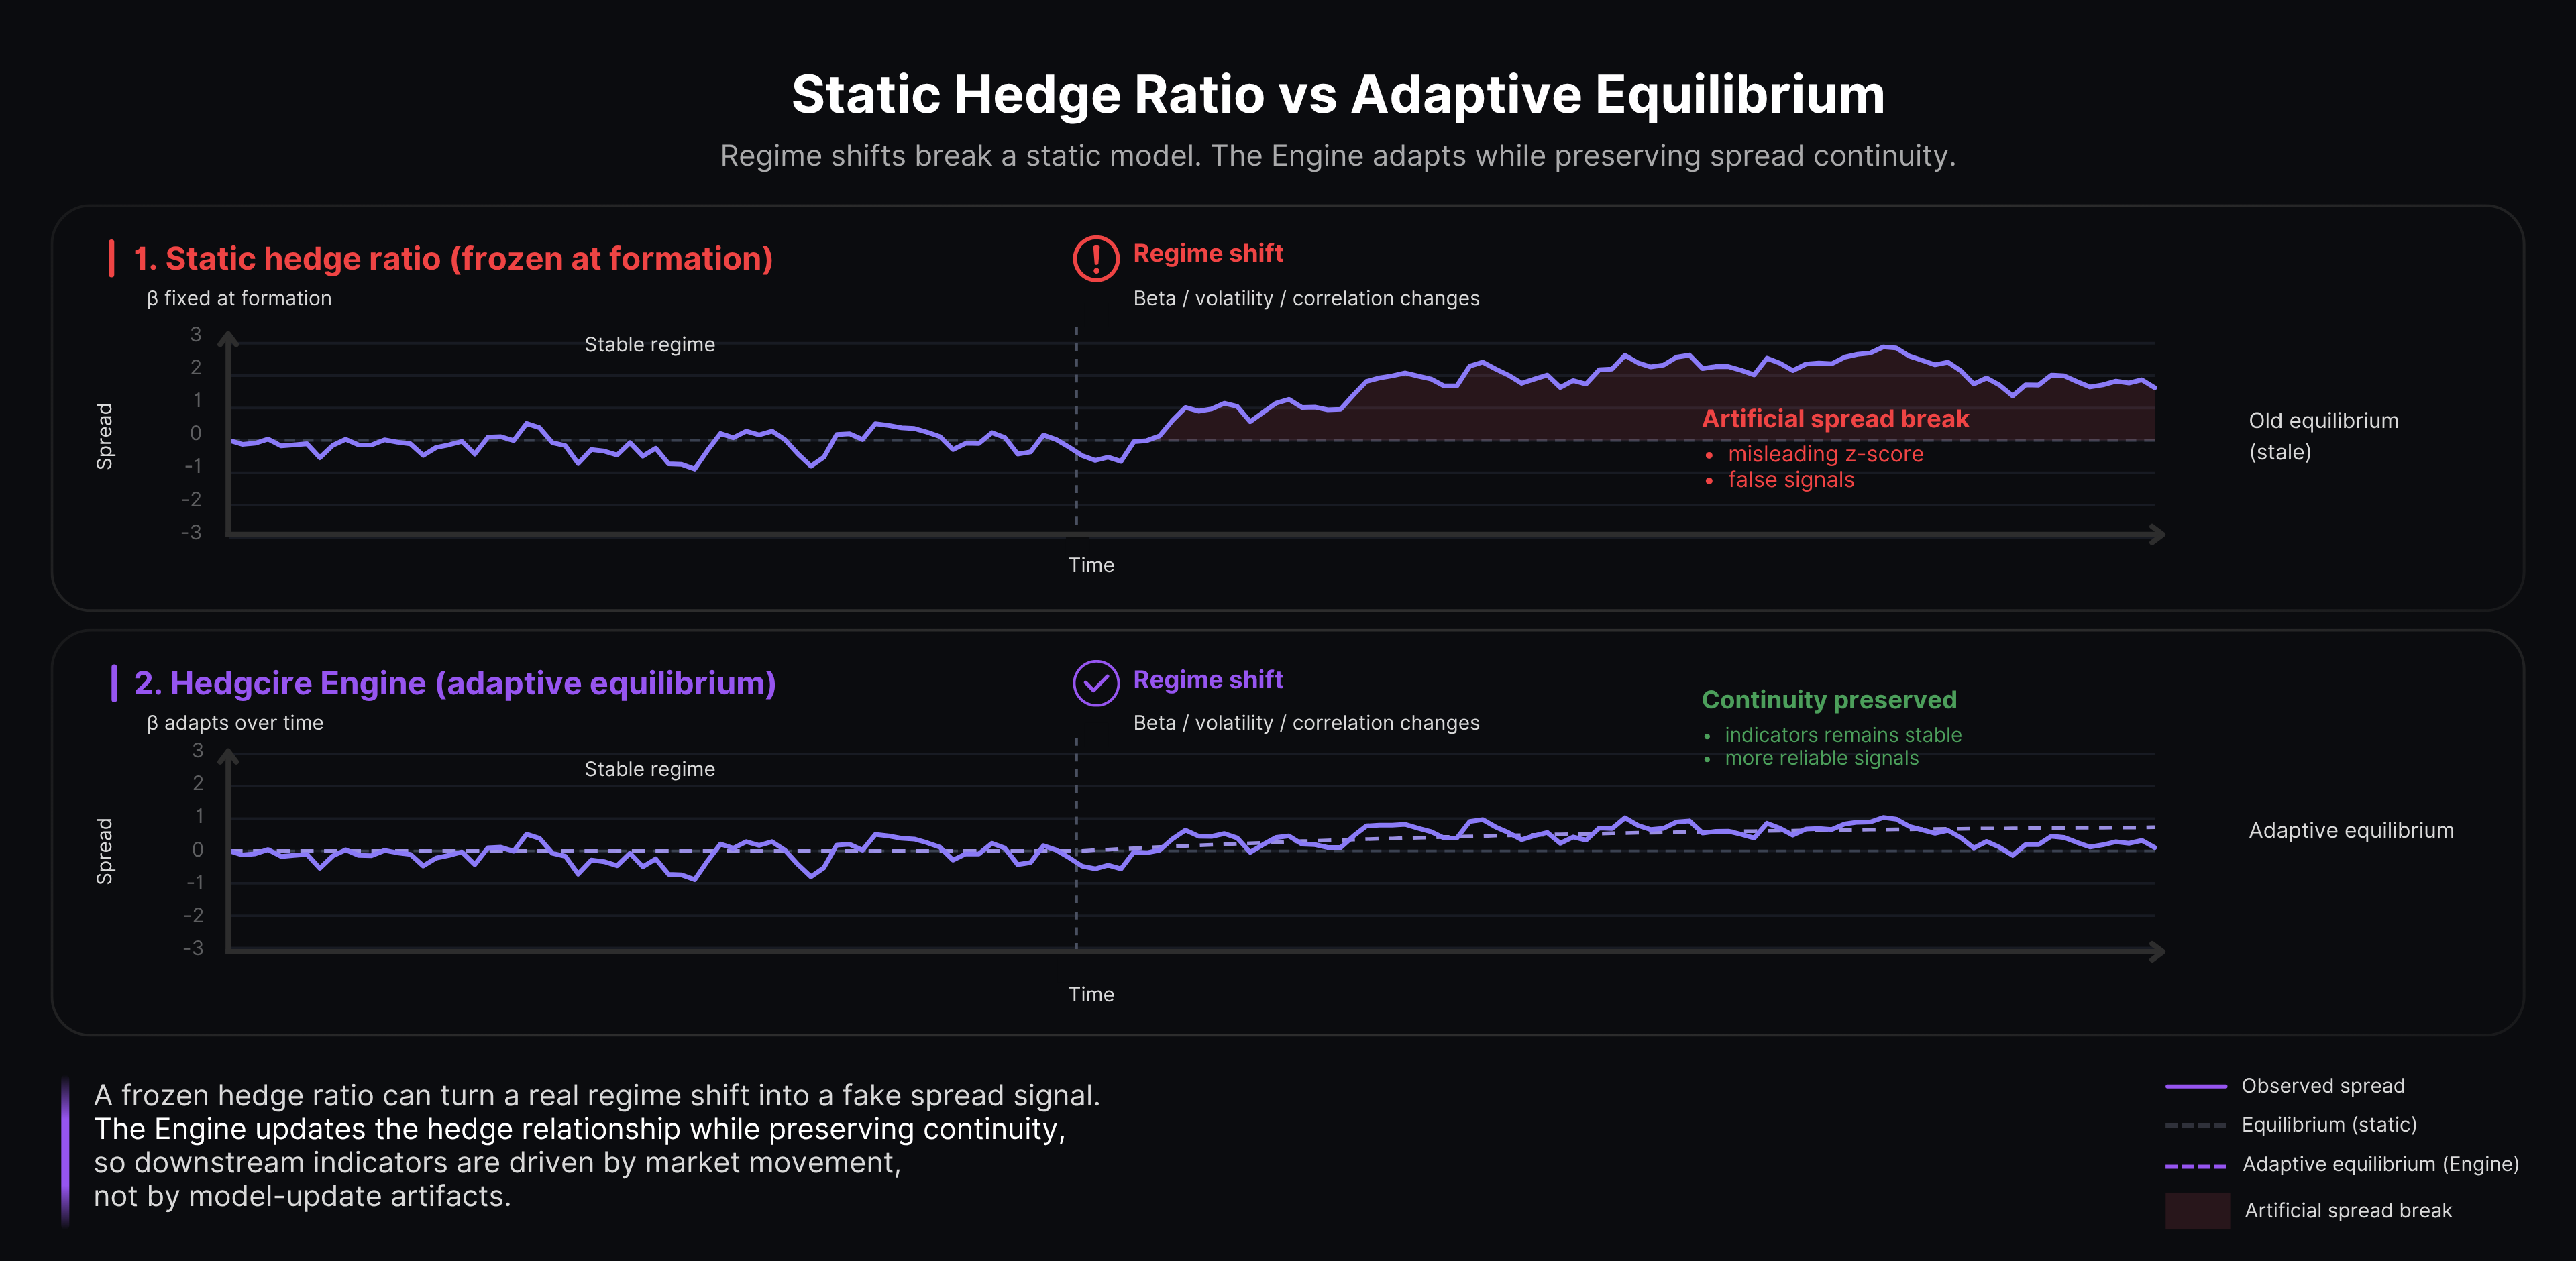
3.1
Adaptive to regime, not frozen in formation.
The Engine maintains a hedge relationship that updates as new market data arrives. Not estimated once and frozen, not left in constant jitter.
3.2
Continuity-preserving by design.
The Engine’s spread output is continuous across hedge updates. Rolling statistics and indicator values are not contaminated by the model’s own updates.
3.3
Regime-aware indicator calibration.
The premium Stretch, Flow, Envelope, Pulse and Glide indicators are the textbook statistics calibrated against the Engine’s adaptive equilibrium and the pair’s current regime characteristics.
3.4
Cost-aware backtest model.
The backtest models perpetual funding, exchange fee schedules and realistic fills. Strategies marginally profitable on a fee-free midpoint backtest correctly show as unprofitable on the Hedgicore backtest.
3.5
No look-ahead, anywhere.
Every estimator uses only data observed at or before each bar. The backtest output is the equity curve a user would have observed if they had run the strategy live from the start of the window.
The Engine's internal estimator formulations, parameter logic and regime mechanics are not published. This section describes design principles and behavioural properties.
§4
Hedgicore supports standard technical indicators (Z-score, MACD, Bollinger Bands, Stochastic, Nadaraya-Watson) applied to the Engine-produced spread. A set of five proprietary Hedgicore indicators calibrated specifically for the spread ships later: Stretch, Flow, Envelope, Pulse and Glide. Each builds on a foundational statistic and is defined below at the conceptual level.
4.1
Stretch
built on Z-score
Captures. How far the spread between two perps sits from where it usually sits.
Foundation. The same Z-score statistic, computed against the Hedgicore Engine’s adaptive equilibrium rather than a rolling-window mean. Stable under regime changes that break the textbook version.
Citation: Engle and Granger (1987); Vidyamurthy (2004).
4.2
Flow
built on MACD
Captures. Directional momentum of the spread between the two legs.
Foundation. MACD calibrated against the adaptive equilibrium’s drift, not against fixed-period moving averages of raw price. Catches divergence the textbook version misses on regime shifts.
Citation: Appel (1979).
4.3
Envelope
built on Bollinger Bands
Captures. The volatility band the spread is currently moving inside.
Foundation. Bollinger-style band with bandwidth calibrated against the pair’s current volatility regime, not a fixed lookback. Width itself tells you whether the regime is calm or turbulent.
Citation: Bollinger (2002).
4.4
Pulse
built on Stochastic Oscillator
Captures. Where the spread sits inside its recent range. Near extremes signals reversion pressure.
Foundation. Bounded oscillator calibrated against the Engine’s adaptive range estimate, expressed relative to the adaptive equilibrium. Useful for timing entries when the textbook Stretch has been at an extreme without reverting.
Citation: Lane (1950s).
4.5
Glide
built on Nadaraya-Watson estimator
Captures. A smoothed line through the spread, used as a chart aid and as the basis for derived signals.
Foundation. Nadaraya-Watson with a kernel bandwidth calibrated against the pair’s regime characteristics. Reads the turn before a fixed-bandwidth smoother would.
Citation: Nadaraya (1964); Watson (1964).
The Hedgicore indicators above ship as an add-on later in 2026. Until then the same five textbook statistics are available on the Engine spread by their textbook names.
§5
Modelled
Not modelled
These omissions are stated openly because the alternative (pretending the backtest is a full execution simulator) produces strategies that look deployable on the screen and lose money in production.
§6
The Engine is versioned. v1 (May 2026) is the version this paper describes. The following extensions are planned for subsequent versions. Inclusion in the roadmap is a statement of direction, not a commitment to a ship date.
Multi-leg portfolios
Three-, four- and five-leg pairs in addition to the current two-leg.
Cross-venue adaptive equilibrium
Engine modelling of the same pair across multiple venues, with venue-specific fee and funding schedules.
Optimal-threshold mode
Entry and exit thresholds on Stretch derived from the Engine’s statistical properties rather than user-configured. Theoretical anchor: Bertram (2010), Zeng and Lee (2014).
Latent-state hedge tracking
Optional state-space hedge ratio estimation for users who prefer continuously-updated hedge ratios. Theoretical anchor: Elliott, van der Hoek, Malcolm (2005).
Tail-aware indicator family
Indicators based on the copula representation of a pair’s joint distribution for regimes where linear correlation breaks down. Theoretical anchor: Liew and Wu (2013), Krauss and Stübinger (2017).
Walk-forward and Monte Carlo robustness diagnostics
A Pro-tier panel that resamples the backtest and reports distributional statistics. Theoretical anchor: Lopez de Prado (2018), Chapters 11 to 13.
§9 REFERENCES
To cite this paper:
Bonton AI, Hedgicore Research (2026). The Hedgicore Engine. A Methodology for Real-Time Statistical Arbitrage on Crypto Perpetuals. Methodology Paper v2.0, May 2026. hedgicore.com/methodology