
What statistical arbitrage actually is, in plain English
The short, opinionated guide to what it is, where it came from and why crypto is the harder version.
Statistical arbitrage is the trade where you stop caring which direction bitcoin goes.
That part gets left out of most explanations. Every other strategy you read about online is some version of "the price will go up" or "the price will go down." Stat arb is different. The price of this thing relative to the price of that thing will revert to where it usually sits. Direction stops mattering. The relationship is the trade.
Walk into a hedge fund in 1988 and you would find rooms full of people doing exactly this on equities. Walk into the same fund today and you would find a bigger room of people doing roughly the same thing with more math behind it. Statistical arbitrage built D.E. Shaw, Two Sigma and PDT Partners. The firms running sixty billion dollars each right now were seeded by the team who set up the first stat arb desk at Morgan Stanley. The strategy is old. It still works.
The math isn't hidden either. It has been published for forty years. What's hidden is the engineering. How you actually run this on data without the model lying to you. That's the interesting problem.
The setup, in one paragraph
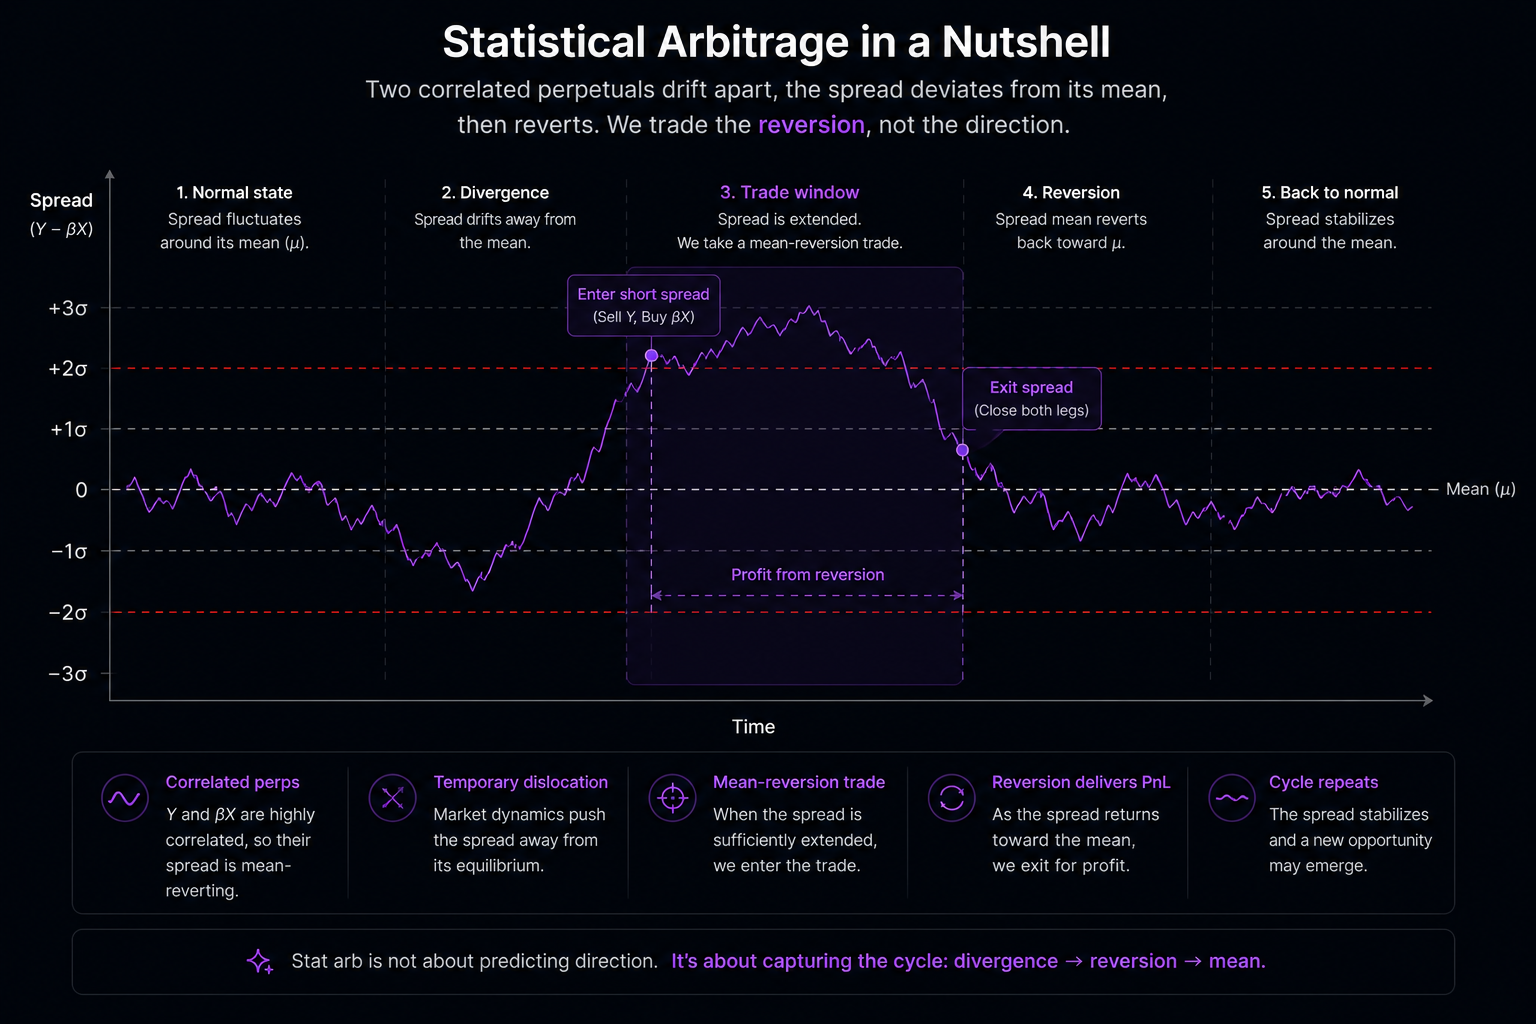
You pick two assets that move together for a real economic reason. Coca-Cola and Pepsi if you trade equities. BTC and ETH if you trade crypto. The two prices live on different scales, so you combine them into a single number called the spread. The spread sits somewhere. Sometimes it drifts far from where it usually sits. When it does, you bet that it will come back. You go long the cheap leg, short the expensive leg and wait. When the spread closes, you take both positions off.
That's the whole strategy.
The work is in three places. Picking the pair. Computing the spread correctly. Deciding when to enter and exit. Hedge funds have spent four decades figuring out how to do each of those three things better. The academic literature has five rough families to show for it.
The five families, briefly
The original public study (Gatev, Goetzmann and Rouwenhorst 2006) matched pairs by normalised price distance and traded the divergence. Simple, model-free, scaled to thousands of pairs. Works less well now because the easy pairs got picked over.
Cointegration (Engle and Granger 1987, Johansen 1991) is the math people actually use. Two assets are cointegrated if some weighted combination of their prices is statistically stationary, even though each price individually drifts. Clive Granger won the 2003 Nobel Prize partly for this. Most modern stat arb is built on top of it. Hedgicore is too.
Stochastic process methods (Bertram 2010, Zeng and Lee 2014) take the spread and model it as a continuous-time process, usually Ornstein-Uhlenbeck. From there you can derive optimal entry and exit thresholds in closed form. Heavier math, useful for sophisticated trading rules.
Copula methods (Liew and Wu 2013) catch non-linear relationships between two assets when linear methods give up. Harder to fit, useful in specific regimes.
Machine learning for pair selection (Sarmento and Horta 2020) is mostly about using clustering algorithms to find economically related pairs at scale. The actual trade rule still sits on cointegration.
Pairs trading isn't one method. It's a toolbox. Different problems get different tools.
Why crypto is the harder version
Everything above was developed on equities. Equity markets close. Equity pairs drift slowly. Equity volatility doesn't change regimes in an afternoon. Crypto markets are open continuously, pair relationships shift in weeks rather than quarters, volatility regimes flip on a single tweet and perpetual futures pay funding every eight hours.
Each of these breaks something about the textbook implementation. A rolling z-score that worked fine on daily equity data fires constantly during a crypto volatility spike because the standard deviation in the denominator hasn't caught up. A hedge ratio fitted in March is wrong by June because one of the assets ran. A backtest that ignores funding will tell you your strategy made money when in reality you paid it back to the exchange every eight hours.
Most of the work in modern crypto stat arb is in handling these substrate problems. Not in the indicator math itself. The indicator math has been in textbooks since the eighties.
Where Hedgicore comes in
Hedgicore builds the spread you trade. An adaptive crypto-perp spread that handles the substrate problems above: the regime drift in the hedge ratio, the funding flows, the cointegration check. That is the part of the platform that does not exist anywhere else.
On top of the spread, you use whatever technical indicator you already know. Z-score, MACD, Bollinger Bands, Stochastic, Nadaraya-Watson. They work the same way they work everywhere else; the difference is what they are computed on. A set of five proprietary Hedgicore indicators (Stretch, Flow, Envelope, Pulse, Glide) calibrated specifically for the spread ships later this year.
The full description of how the Engine builds the spread and what the backtest models is in the methodology paper. Read the methodology →
A few questions worth asking
Is statistical arbitrage the same as pairs trading?
Pairs trading is the simplest case. All pairs trading is stat arb. Stat arb extends to portfolios of three or more related assets when you want it to.
Does stat arb still work?
Yes, on substrates where the modelling can be done correctly. Crypto perps are one of those. Equities are still one too, though competition has eaten most of the easy alpha.
Do I need a PhD?
No. You need to understand cointegration well enough to know when a pair is qualified, you need a backtest that doesn't lie to you about fees and funding, and you need the discipline to follow the rules. None of those require a PhD.
Where do I read more?
The methodology paper is at hedgicore.com/methodology. The references at the bottom of this post are where the math comes from.
References
- Engle, R.F. and Granger, C.W.J. (1987). Co-Integration and Error Correction. Representation, Estimation and Testing. Econometrica 55(2).
- Vidyamurthy, G. (2004). Pairs Trading. Quantitative Methods and Analysis. Wiley.
- Gatev, E., Goetzmann, W.N. and Rouwenhorst, K.G. (2006). Pairs Trading. Performance of a Relative-Value Arbitrage Rule. Review of Financial Studies 19(3).
- Pole, A. (2007). Statistical Arbitrage. Algorithmic Trading Insights and Techniques. Wiley.
- Avellaneda, M. and Lee, J.H. (2010). Statistical Arbitrage in the U.S. Equities Market. Quantitative Finance 10(7).
- Bertram, W.K. (2010). Analytic Solutions for Optimal Statistical Arbitrage Trading. Physica A.
- Krauss, C. (2017). Statistical Arbitrage Pairs Trading Strategies. Review and Outlook. Journal of Economic Surveys 31(2).
- Lopez de Prado, M. (2018). Advances in Financial Machine Learning. Wiley.
- Bonton AI, Hedgicore Research (2026). The Hedgicore Engine. A Methodology for Real-Time Statistical Arbitrage on Crypto Perpetuals. v2.0.
Hedgicore is a real-time pairs analytics platform powered by the Hedgicore Engine. Built by the team at Bonton AI.
Risk disclaimer: Hedgicore is an analytics platform. It does not execute trades or provide financial advice. All trading carries risk of loss.